
Replace the Home Tab in Excel with Python—PyderPuffGirls Episode 7
In this post, I will show you the how to automate Excel away using the Python package openpyxl, starting with every button on the Home Tab. No more drag and drop!
I wrote this post with Ctrl+F in mind: find the button you want to replace, then search!
Intro
Excel doesn’t need an intro. Let’s get down to business. Bye Clippy 👋😊…ain’t gonna miss you.

Goal
My goal for this post is simple: replace the Home Tab.
Installation
I will use the Python module pandas and openpyxl. To install, run in command line
pip install --user pandas openpyxl
The tasks
According to the Home Tab, I will go through
But before that, let’s walk through how to save a pandas dataframe to an Excel file.
Example code: the workbook object
First, I want to explain how to save the following dataframe to Excel. It uses the dataframe_to_rows function to write the rows into the spreadsheet.
The idea is to open a Workbook object, write into a worksheet in the workbook, then close the workbook and save the file.
To pick which sheet to work on, I can use
- the
.activemethod to pick the active worksheet (default to the first one when first opened.) Workbook.create_sheet()to create new sheet.- combine
Workbook.sheetnamesandWorkbook['some_name']to pick a particular sheet
import pandas as pd
from openpyxl import Workbook
from openpyxl.utils.dataframe import dataframe_to_rows


df = pd.DataFrame({
    'name': ['cabbage', 'cheese'],
    'cost': ['2.0', '5.0']
})

df2 = pd.DataFrame({
    'name': ['ham', 'eggs'],
    'cost': ['23.0', '4.0']
})

file = 'grocery_cost.xlsx'

wb = Workbook()

# pick the active sheet
worksheet1= wb.active

# set the sheet title
worksheet1.title = 'today'

# Write into the first sheet
# if using index=True, the spreadsheet will have a weird whitespace row between header and values
for r in dataframe_to_rows(df, index=False, header=True):
    worksheet1.append(r)

# make another sheet
wb.create_sheet('yesterday')

# pick the sheet
worksheet2 = wb['yesterday']

for r in dataframe_to_rows(df2, index=False, header=True):
    worksheet2.append(r)

# Save the file
wb.save(filename=file)
wb.close()
The code saves the two dataframes to the two sheets inside the excel file grocery_cost.xlsx.
I can also check what the sheet names are:
print(wb.sheetnames)
['today', 'yesterday']
How to pick a cell
Almost everything in openpyxl works on a cell-by-cell basis. How do I select a cell?
There are two ways:
- I can select a cell using the coordinates—A2, C3, etc—that corresponds to the row and column index inside Excel.
- I can also select a cell using the row/column index, say row = 1, column = 2, etc.
For now, I will stick to the coordinate style (ABC for columns, 123 for rows) for selecting cells.
Click on this link to go to the section on “Font” and see the example on how to select cells.
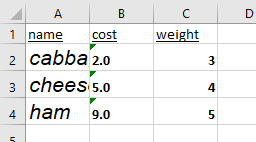
Example code #2
To walk through all the buttons on the Home tab, I am going to use the following code over and over, and only replace the “styling code” part a the corresponding function.
import pandas as pd
from openpyxl import Workbook
from openpyxl.utils.dataframe import dataframe_to_rows
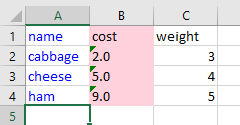
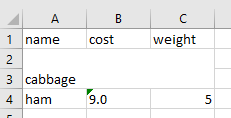
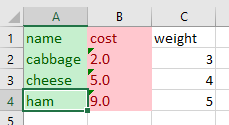
df = pd.DataFrame({
'name': ['cabbage', 'cheese', 'ham'],
'cost': ['2.0', '5.0', '9.0'],
'weight': [3, 4, 5]
})
file = 'grocery_cost_with_style.xlsx'
wb = Workbook()
# pick the active sheet
worksheet = wb.active
# Write into the first sheet
for r in dataframe_to_rows(df, index=False, header=True):
worksheet.append(r)
...some styling code here...
# Save the file
wb.save(filename=file)
wb.close()
Trick: the product function from itertools
When selecting a rectangular region of cells, I can write a double for loop (nested for loop) to iterate through the rows and columns:
num_rows = df.shape[0]

for column in 'ABCD':
    # see note below
    for row in range(2, num_rows + 2):
        worksheet[f'{column}{row}'].do_something()
If there are too many nested loops and readability is an issue, one way to “flatten” nested loops and get the same output is using the product() function from the Python base module itertools, which takes a cartesian product of sequences—now I only need unpack the variables in a single loop:
from itertools import product

num_rows = df.shape[0]

rectangle = product('ABCD', range(2, num_rows + 2))
for column, row in rectangle:
    worksheet[f'{column}{row}'].do_something()
Note: About the range(2, num_rows + 2),
- the first 2 is due to that the “value” in my Excel spreadsheet starts on row 2, and
- the second 2 is needed because Python’s
range()function excludes the right endpoint.
Time to go through the Home Tab!
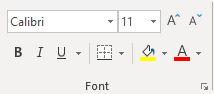
Font
There are three categories:
- Text formats
- Fills
- Borders
Font, size, bold, italics, and underscore
To change the font and fontsize, modify cell.font. For example, if I want the following:
- Underline my header.
- For column A, use the size 16 Arial and italicize.
- Bold column B and C.
I can first set the font.
from openpyxl.styles import Font

header_font = Font(
    underline='single'
)

name_font = Font(
    name='Arial',
    size=16,
    italic=True
)

value_font = Font(
    bold=True
)
then apply the font on the target cells with for loops
# count number of rows in a pandas dataframe
num_rows = df.shape[0]

# get everything in row 1
for cell in worksheet['1']:
    cell.font = header_font

# get everything in column A, but skip row 1, the header row.
for cell in worksheet['A']:
    if cell.row > 1:
        cell.font = name_font


for column, row in product('BC', range(2, num_rows + 2)):
    worksheet[f'{column}{row}'].font = value_font
makes
Text color, cell fill color
There are two ways to pick a color in openpyxl:
- Use the built-defaults from
openpyxl.styles.colors - Use the color hex code, such as
#FFFF00, yellow.
Let’s say I want to
- change the text color of column A to blue, and
- fill column B with millenial pink (
#FFd1DC),
I can write
from openpyxl.styles import colors, PatternFill
A_font = Font(color=colors.BLUE)
# note that the "#" in the hex code is replaced with two zeros
B_fill = PatternFill(fill_type='solid', fgColor='00FFd1DC')

for cell in worksheet['A']:
    cell.font = A_font

for cell in worksheet['B']:
    cell.fill = B_fill
and get
To read more about options of PatternFill, please refer to documentation.
Borders
The border information sits inside the Border() object. It takes many arguments, which can be found in the __fields__ part of its source code.
__fields__ = (
    'left',
    'right',
    'top',
    'bottom',
    'diagonal',
    'diagonal_direction',
    'vertical',
    'horizontal'
)
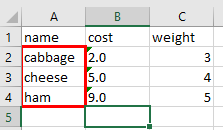
Borders are trickier because we might not want to apply the same border to all cells in a column, but instead only trace its boundary. For example, I can put a red thick border around the food names in column A:
from openpyxl.styles import Border, Side, colors

last_row = df.shape[0] + 1

custom_side = Side(border_style='thick', color=colors.RED)

# define all four sides of the box. Top:
worksheet['A2'].border = worksheet['A2'].border + Border(top=custom_side)

# left and right:
for cell in worksheet['A']:
    if cell.row >= 2 and cell.row <= last_row:
        cell.border = cell.border + Border(left=custom_side, right=custom_side)

# bottom:
worksheet[f'A{last_row}'].border = worksheet[f'A{last_row}'].border + Border(bottom=custom_side)
Alignment
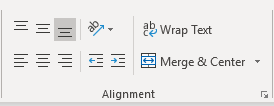
Text alignment
There are a few things we can do with texts:
- Top/middle/bottom align
- Left/center/right align
- Text rotation
- Wrap text
According to the styles guide, I can set cell.alignment with the Alignment object:
from openpyxl.styles import Alignment

alignment=Alignment(
  horizontal='general',
  vertical='bottom',
  text_rotation=0,
  wrap_text=False,
  shrink_to_fit=False,
  indent=0
)
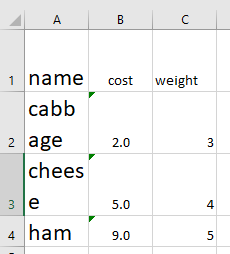
For example, I can
- set column A to font 18 and apply text wrap
- set column B to center align
from openpyxl.styles import Alignment

A_font = Font(size=18)
A_alignment = Alignment(wrap_text=True)
B_alignment = Alignment(horizontal='center')

for cell in worksheet['A']:
    cell.font = A_font
    cell.alignment = A_alignment

for cell in worksheet['B']:
    cell.alignment = B_alignment
Merge and center
To merge, define the range of cells to merge and call the Worksheet.merge_cells() method.
Let’s say I want to merge column A to C for row 2 and row 3, then
# define the rectangle by specifying the top left and bottom right corner
worksheet.merge_cells('A2:C3')
 only top left cell’s value remains after merge
- For more information about merging cells, see the documentation on usage.
Styling a merged cell is similar to a normal cell. The only thing to note is that the merged cell uses the top-left cell from the group of cells I used to merge, so only the styles applied to said cell will show.
Number
For this one, let me change my dataframe a little bit so I can show you the thousand separator number styles:
df = pd.DataFrame({
    'name': ['cabbage', 'cheese', 'ham'],
    'cost': [-2345.123, 45678.12, 9999.99],
    'proportion': [0.2, 0.8714, 0.0386]
})
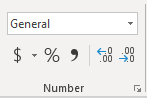
I use the buttons here to do a few things:
- Accounting number (currency)
- Percent style
- Comma style (thousand separators)
- Move the decimal
and most of them can be done by modifying cell.number_format.
The only place where I could find example of the number formats are from here:
Under the BUILTIN_FORMATS are all the possible formats. In particular,
- 1 and 2 show how to set the decimal points
- 5 to 8 are the currency formats because they have a
$sign with commas - 9 and 10 are percent styles
Because of the lack of documentation, it’s best to learn the styles through trial-and-error.
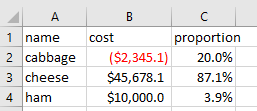
For example, if I want to
- set the column B, cost, using currency format, with thousand separator, and round to 1 decimal place e.g.
$45678.1, and negative numbers should be red with parentheses. - set the column C, proportion, with the percent format and round to 1 decimal place e.g.
3.9%
then I can write the following:
# currency, modified from BUILTIN_FORMATS 7. Note there's only one zero after the periods.
for cell in worksheet['B']:
    cell.number_format = '"$"#,##0.0_);[RED]("$"#,##0.0)'

# percent, modified from BUILTIN_FORMATS 10
for cell in worksheet['C']:
    cell.number_format = '0.0%'
Styles
Conditional formatting
I will delay this to the next post. It may be easier, however, to write the conditional logic inside Python using pandas, then apply the format directly using Python conditions.
Format as table
I will delay this to the next post.
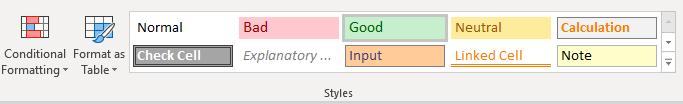
Built-in styles
The easiest way to imitate the Excel styles is to pick the corresponding cell.style from the openpyxl documentation based on the Excel built-in styles
Note. the built-in style is limited to what is shown on the page and only take English names, so please refer to it.
For example, to use
- the “Good” style on column A
- the “Bad” style on column B,
I can take what the Excel shows on the Styles sections and apply:
for cell in worksheet['A']:
    cell.style = 'Good'

for cell in worksheet['B']:
    cell.style = 'Bad'
Cells
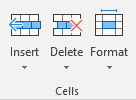
Format: autofit column width
One of the things I often do when I get a spreadsheet is to autofit the column width. Unfortunately, there is not a “autofit” function in openpyxl.
We can, however, calculate the width of all the data then choose the appropriate widths ourselves.
- Here’s a good StackOverflow answer on that
The only thing I would change is using
length + 1instead oflengthas sometimes Excel still hides letters with this solution.
Editing
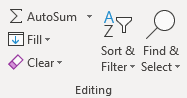
Sort and filter
Although openpyxl does support filter and sort, my take is that most of the functionalities here are better done within pandas, but the business users may still want to get that “Filter” dropdown on the columns, so I will leave it to you.
Useful links
- Working with styles: https://openpyxl.readthedocs.io/en/stable/styles.html Most of the styling syntax examples come from here.
What’s next?
Excel is a complex program, that’s why this post is so long. After I wrote this, I realize that I do use most of the functionalities on the Home tab, so it is good to get them out of the way. No more drag and drop!
The next post is the last post in this 8-post series. To finish, let’s dig even deeper with Excel and see how far we can push it, including how to
- define formula, and
- make charts
More PyderPuffGirls